 A friend of mine casually asked a question that I wanted to be able to answer. She became hospitalized from her booster shot, and she wondered how many others had issues who took the same vaccine lot number as she did.
I wanted to be able to find the answer.
I have said before that I hold data in many respects equal to or above science and more specifically the administration of science. I did this leg work so that for others it is easier, and more accessible. I want folks to feel like they can know when something is real. Data is real. It's represents a collected reality over time. This data in particular represents lives ruined. It holds a weight above numbers.
Before I talk about how to get the data onto your own database (with code examples below), I want to talk about the results I am finding.
The first result is that this data is very difficult for most people to look at even with a working knowledge of spreadsheets.
The reasons are: 1) the data files are enormous and will destroy most people's memory the minute they open it, and 2) they are encoded as Windows CSV files, so if you are on Linux or on a Mac, and have enough of a memory capacity to open the files with Excel or OpenOffice, they will lay waste to the data by assuming that every comma, including the comma's in text or written log fields, creates a new column for that row rendering the data the equivalent of a hair comb with different sized teeth.
But really what makes these data sets difficult is that they are enormous. Most website database queries happen in a matter of microseconds, but the ones in this database take half an hour some of them to respond.
It's a lot for most people to digest, let's just say.
The datasets can be seen here: https://vaers.hhs.gov/data/datasets.html? , and you do not even need to download them to see what is happening. Just look at the file sizes over time to see the writing on the wall.
If you would like to see someone else's renditions of the VAERS data, here is one I like:
https://vaersanalysis.info/2022/01/14/vaers-summary-for-covid-19-vaccines-through-01-07-2022/
Findings
The count of vaccine lots (each comprised of many many vials of vaccines) with 3 or less incidences of adverse reactions reported are 122,923. Keep in mind two things. 1) There are many vaccine lots that had no issues and so received no reports. 2) And there are also incidences of adverse reactions which are never reported.
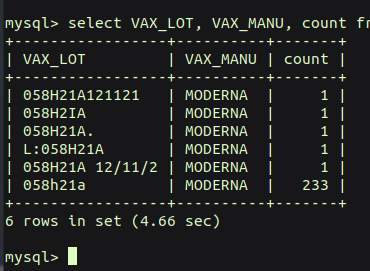
While you see here that 'only' 238 people have reported effects from the same lot number as my friend, it actually places the lot of her booster shot solidly in the 99.7th percentile in the set of all vaccines over the last 31 years.
In other words, even though her lot only shows 238 adverse reactions, that is statistically a staggering number when the solid majority (72%) of vaccine lots score under 3 adverse reactions reported.
Again. Reported.
Keep in mind that the incidence of my friend's adverse reaction, which has had her in and out of the hospital for the last 3 months, was NOT reported, and may never be. Also keep in mind that there must be vaccine lots that have no reports associated with them.
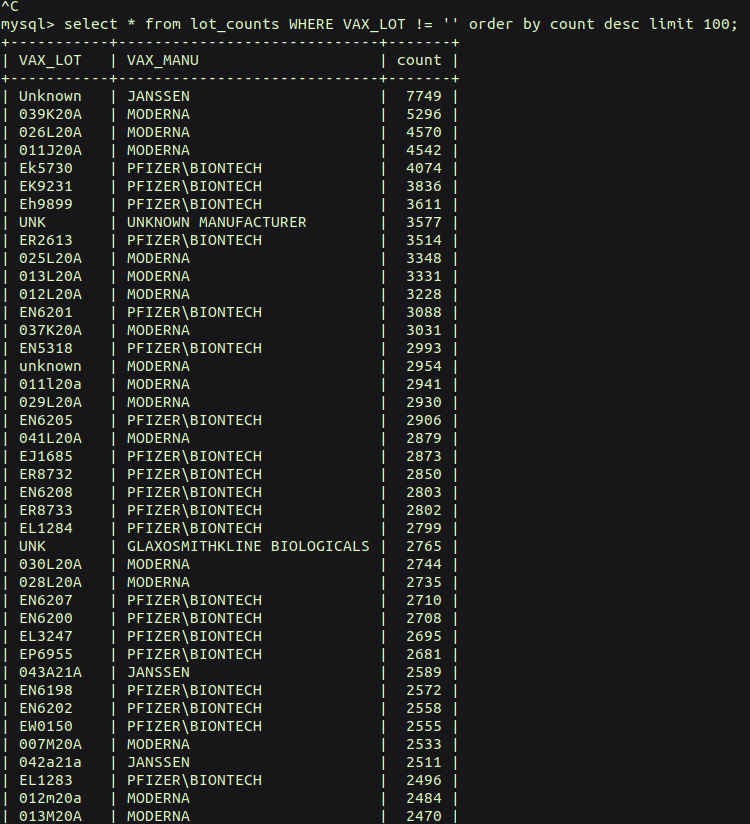
The 100 most adverse lots (there are 171,197 unique lots with adverse reactions reported) have reporting numbers that span from 7749-1707 adverse reactions per lot.
If you are interested in knowing more in general or about a specific vaccine lot or set of data, feel free to contact me: ana[at]jellobrain<dot>com.
If you scroll to the VERY BOTTOM of this blog, you can download the speadsheet I exported this data into and worked with. I saved it as an Excel Spreadsheet to make it easier for everyone. ;)
Now for some pictures.
Here is a query of the most ADVERSE vaccine lots (including all types of vaccines) in the last 31 years:

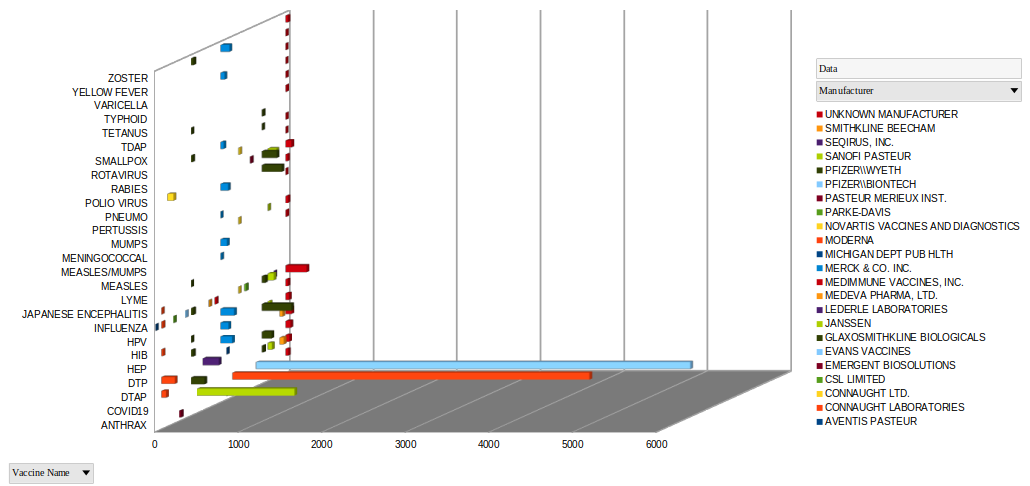
This chart quantifies incidences of DEATH for the top 1000 most deadly vaccine lots from 1990 til the end of 2021.

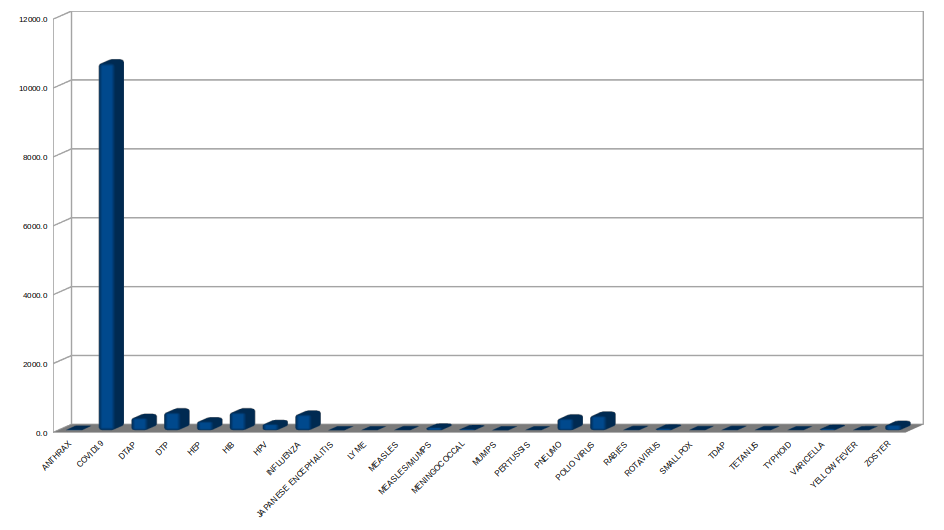
And this quantifies vaccine DEATHS (for the 1000 most deadly vaccine lots) by the type of vaccine only from 1990 to the end of 2021. Keep in mind that we have only really had a year of COVID vaccines, and the data, for example, for Polio or Influenza spans from 1990 to the present (31 years):
Imagine in this picture that the long column of COVID represents a Brobdingnag 1 year old baby boy, whereas the little lumps beside it each represent a 31 year old Lilliputian man. It's difficult not to wonder what has been birthed here...

Uploading the Data
I know that the VAERS dataset comes with files that you can use to upload their data into a database, but I wanted to take a stab at doing it myself.
It works for the data up through 2021. In the same folder as your UNOPENED and UNZIPPED VAERS CSV files place the two files below.
You do not want to open them with a spreadsheet program, and the reason is that it will invariably change the formatting of your CSV in ways that will give you headaches.
Start with a database in your MySQL called VAERS. In the 'vaersupload.py' file, you will need to add your credentials. I have marked the spot with a TODO. You will want to make sure you have the data in the same folder as these files, and you will need to have Python3 installed along with the libraries that are imported at the beginning of both files. Plenty of information online about how to do that.
You will want to open the file from a Terminal (from the folder where the files are) by typing: 'python3 vaersupload.py'.
It will take care of everything for you, and could take upwards of two hours to complete. Again, the only thing you would need to start with is an empty database called 'VAERS', and the correct user/password added to 'vaersupload.py'.
Remember, these are LARGE datasets, so be prepared and plan for this process to gobble up resources and time. The good news is that once it is up, the individual queries you will no doubt invent to ask the data questions will take less time (but still some time) to complete.
vaersupload.py
#!/usr/bin/env python3

# This is a sample Python script.
# THIS CODE ASSUMES YOU HAVE AN EMPTY DATABASE CALLED 'VAERS'.
# It also assumes that you have downloaded the complete data set from the VAERS website and
# that you placed that data in the same folder as these files.
# https://vaers.hhs.gov/data/datasets.html?
# Press Shift+F10 to execute it or replace it with your code.

# Press Double Shift to search everywhere for classes, files, tool windows, actions, and settings.
from datetime import datetime

import connection

import pandas as pd
def main():

    # TODO: Connect to MYSQL with your USERNAME and PASSWORD, by replacing them bellow:

    conn = connection.connect('USERNAME', 'PASSWORD')
    # Create the tables.

    sqldata = "Create table data(VAERS_ID int(6), RECVDATE date null, STATE varchar(7) null, AGE_YRS float null, " \

              "CAGE_YR float null, CAGE_MO float null, SEX varchar(7) null, RPT_DATE date null, " \

              "SYMPTOM_TEXT longtext null, DIED varchar(7) null, DATEDIED date null, L_THREAT varchar(7) null, " \

              "ER_VISIT varchar(7) null, HOSPITAL varchar(7) null, HOSPDAYS int(3) null, X_STAY varchar(7) null, " \

              "DISABLE varchar(7) null, RECOVD varchar(7) null, VAX_DATE date null, ONSET_DATE date null, " \

              "NUMDAYS int(5) null, LAB_DATA longtext null, V_ADMINBY varchar(7) null, V_FUNDBY varchar(7) null, " \

              "OTHER_MEDS varchar(240) null, CUR_ILL longtext null, HISTORY longtext null, " \

              "PRIOR_VAX varchar(128) null, SPLTTYPE varchar(25) null, FORM_VERS int(1) null, TODAYS_DATE date null, " \

              "BIRTH_DEFECT varchar(7) null, OFC_VISIT varchar(7) null, ER_ED_VISIT varchar(7) null, " \

              "ALLERGIES longtext null)"
    sqlvax = "Create table vax(VAERS_ID int(6) null, VAX_TYPE varchar(15) null, VAX_MANU varchar(40) null, " \

             "VAX_LOT varchar(15) null, VAX_DOSE_SERIES varchar(7) null, VAX_ROUTE varchar(7) null, " \

             "VAX_SITE varchar(7) null, VAX_NAME varchar(100) null)"
    sqlsymptoms = "Create table symptoms(VAERS_ID int(6), SYMPTOM1 varchar(100) null, SYMPTOMVERSION1 float null, " \

                  "SYMPTOM2 varchar(100) null, SYMPTOMVERSION2 float null, SYMPTOM3 varchar(100) null, " \

                  "SYMPTOMVERSION3 float null, SYMPTOM4 varchar(100) null, SYMPTOMVERSION4 float null, " \

                  "SYMPTOM5 varchar(100) null, SYMPTOMVERSION5 float null)"
    # Execute the table creation queries and commit them.

    cursor = conn.cursor()

    cursor.execute(sqldata)

    cursor.execute(sqlvax)

    cursor.execute(sqlsymptoms)

    conn.commit()
    # Create the base names for each of the csv types.

    vbasename = 'VAERSVAX.csv'

    sbasename = 'VAERSSYMPTOMS.csv'

    dbasename = 'VAERSDATA.csv'
    # Now process the data for each year into the database 'vax' table.

    for x in range(1990, 2022):

        vname = str(x) + vbasename

        print(vname)

        # Read the data and place it into a dataframe. NOTE THE ENCODING.

        vdata = pd.read_csv(vname, encoding="Windows-1252", delimiter=",")

        vdataframe = pd.DataFrame(data=vdata)
        # Manage all the empty values.

        for v in vdataframe.values:

            for i in range(0, 8):

                if pd.isna(v[i]) and isinstance(v[i], str):

                    v[i] = None

                elif pd.isna(v[i]) and isinstance(v[i], float):

                    v[i] = None

                elif pd.isna(v[i]) and isinstance(v[i], int):

                    v[i] = None
            # Insert them into the database table.

            cursor = conn.cursor()

            sql = 'INSERT INTO vax (VAERS_ID, VAX_TYPE, VAX_MANU, VAX_LOT, VAX_DOSE_SERIES, VAX_ROUTE, VAX_SITE, ' \

                  'VAX_NAME) VALUES (%s, %s, %s, %s, %s, %s, %s, %s)'

            val = (v[0], v[1], v[2], v[3], v[4], v[5], v[6], v[7])

            cursor.execute(sql, val)
conn.commit()
    # Now process the data for each year into the database 'symptoms' table.

    for x in range(1990, 2022):

        sname = str(x) + sbasename

        print(sname)

        # Read the data and place it into a dataframe. NOTE THE ENCODING.

        sdata = pd.read_csv(sname, encoding="Windows-1252", delimiter=",")

        sdataframe = pd.DataFrame(data=sdata)
        # Manage all the empty values.

        for s in sdataframe.values:

            for i in range(0, 11):

                if pd.isna(s[i]) and isinstance(s[i], str):

                    s[i] = None

                elif pd.isna(s[i]) and isinstance(s[i], float):

                    s[i] = None

                elif pd.isna(s[i]) and isinstance(s[i], int):

                    s[i] = None
            # Insert them into the database table.

            cursor = conn.cursor()

            sql = 'INSERT INTO symptoms (VAERS_ID, SYMPTOM1, SYMPTOMVERSION1, SYMPTOM2, SYMPTOMVERSION2, ' \

                  'SYMPTOM3, SYMPTOMVERSION3, SYMPTOM4, SYMPTOMVERSION4, SYMPTOM5, SYMPTOMVERSION5) ' \

                  'VALUES (%s, %s, %s, %s, %s, %s, %s, %s, %s, %s, %s)'

            val = (s[0], s[1], s[2], s[3], s[4], s[5], s[6], s[7], s[8], s[9], s[10])

            cursor.execute(sql, val)
conn.commit()
    # Now process the data for each year into the database 'data' table.

    for x in range(1990, 2022):

        dname = str(x) + dbasename
        # Read the data and place it into a dataframe. NOTE THE ENCODING.

        ddata = pd.read_csv(dname, encoding="Windows-1252", delimiter=",")

        ddataframe = pd.DataFrame(data=ddata)
        # Using the dataframe, we want to first work with the RECVDATE column to make sure it is formatted as a date.

        ddataframe["RECVDATE"] = pd.to_datetime(ddataframe["RECVDATE"], format="%m/%d/%Y")

        ddataframe["RECVDATE"] = ddataframe["RECVDATE"].dt.strftime("%Y-%m-%d")
        # Using the dataframe, we want to first work with the RPT_DATE column to make sure it is formatted as a date.

        ddataframe["RPT_DATE"] = pd.to_datetime(ddataframe["RPT_DATE"], format="%m/%d/%Y")

        ddataframe["RPT_DATE"] = ddataframe["RPT_DATE"].dt.strftime("%Y-%m-%d")
        # Using the dataframe, we want to first work with the DATEDIED column to make sure it is formatted as a date.

        ddataframe["DATEDIED"] = pd.to_datetime(ddataframe["DATEDIED"], format="%m/%d/%Y")

        ddataframe["DATEDIED"] = ddataframe["DATEDIED"].dt.strftime("%Y-%m-%d")
        # Using the dataframe, we want to first work with the VAX_DATE column to make sure it is formatted as a date.

        ddataframe["VAX_DATE"] = pd.to_datetime(ddataframe["VAX_DATE"], format="%m/%d/%Y")

        ddataframe["VAX_DATE"] = ddataframe["VAX_DATE"].dt.strftime("%Y-%m-%d")
        # Using the dataframe, we want to first work with the TODAYS_DATE column to make sure it is formatted as a date.

        ddataframe["TODAYS_DATE"] = pd.to_datetime(ddataframe["TODAYS_DATE"], format="%m/%d/%Y")

        ddataframe["TODAYS_DATE"] = ddataframe["TODAYS_DATE"].dt.strftime("%Y-%m-%d")
        # Manage all the empty values.

        for d in ddataframe.values:

            # First manage empty dates.

            dates = [1, 7, 10, 18, 19, 30]

            for i in dates:

                if pd.isna(d[i]):

                    d[i] = None
                if isinstance(d[i], datetime) or pd.isna(d[i]):

                    pass

                elif isinstance(d[i], str) and d[i][2] == "/" or isinstance(d[i], str) and d[i][1] == "/":

                    d[i] = pd.to_datetime(d[i], format="%m/%d/%Y")

                    d[i] = d[i].strftime("%Y-%m-%d")
            # Now manage empty data.

            for i in range(0, 35):

                if i not in dates:

                    if pd.isna(d[i]):

                        if i == 4:

                            d[i] = None

                        elif i == 5:

                            d[i] = None

                        elif isinstance(d[i], str) and len(d[i]) < 1:

                            d[i] = None

                        elif isinstance(d[i], float):

                            d[i] = None

                        elif isinstance(d[i], int):

                            d[i] = None

                        else:

                            pass
            # Insert them into the database table.

            cursor = conn.cursor()

            sql = 'INSERT INTO data (VAERS_ID, RECVDATE, STATE, AGE_YRS, CAGE_YR, CAGE_MO, SEX, RPT_DATE, ' \

                  'SYMPTOM_TEXT, DIED, DATEDIED, L_THREAT, ER_VISIT, HOSPITAL, HOSPDAYS, X_STAY, DISABLE, ' \

                  'RECOVD, VAX_DATE, ONSET_DATE, NUMDAYS, LAB_DATA, V_ADMINBY, V_FUNDBY, OTHER_MEDS, CUR_ILL, ' \

                  'HISTORY, PRIOR_VAX, SPLTTYPE, FORM_VERS, TODAYS_DATE, BIRTH_DEFECT, OFC_VISIT, ER_ED_VISIT, ' \

                  'ALLERGIES) VALUES (%s, %s, %s, %s, %s, %s, %s, %s, %s, %s, %s, %s, %s, %s, %s, %s, %s, %s, %s, ' \

                  '%s, %s, %s, %s, %s, %s, %s, %s, %s, %s, %s, %s, %s, %s, %s, %s)'

            val = (d[0], d[1], d[2], d[3], d[4], d[5], d[6], d[7], d[8], d[9], d[10], d[11], d[12], d[13], d[14],

                   d[15], d[16], d[17], d[18], d[19], d[20], d[21], d[22], d[23], d[24], d[25], d[26], d[27], d[28],

                   d[29], d[30], d[31], d[32], d[33], d[34])

            cursor.execute(sql, val)
print(f'{dname}')
conn.commit() # Do the commits all at once.
if __name__ == '__main__':

    main()
connection.py
#!/usr/bin/env python3

# This is a sample Python script.
# Press Shift+F10 to execute it or replace it with your code.

# Press Double Shift to search everywhere for classes, files, tool windows, actions, and settings.

import mysql.connector
# First configure the connection.

def connect(user, password):

    conn = mysql.connector.connect(

        host="127.0.0.1",

        port=3306,  # 2433

        user=user,

        password=password,

        database='VAERS'

    )

    return conn
