I believe that many sacred and ancient texts/manuscripts/diagrams exhibit a holographic quality in that they are small pieces of a larger reality with enough key information that would enabled it to become in some ways reverse engineered or passed through a perceptual filter that enabled a view of a more complete system if you look at it long enough.
I am certain you are aware of the work being done on the Torah in which it behaves as almost a holographic film in which information is encoded that can be unlocked if you have the key/code as with Michael Drosnin's work 'The Bible Code'.
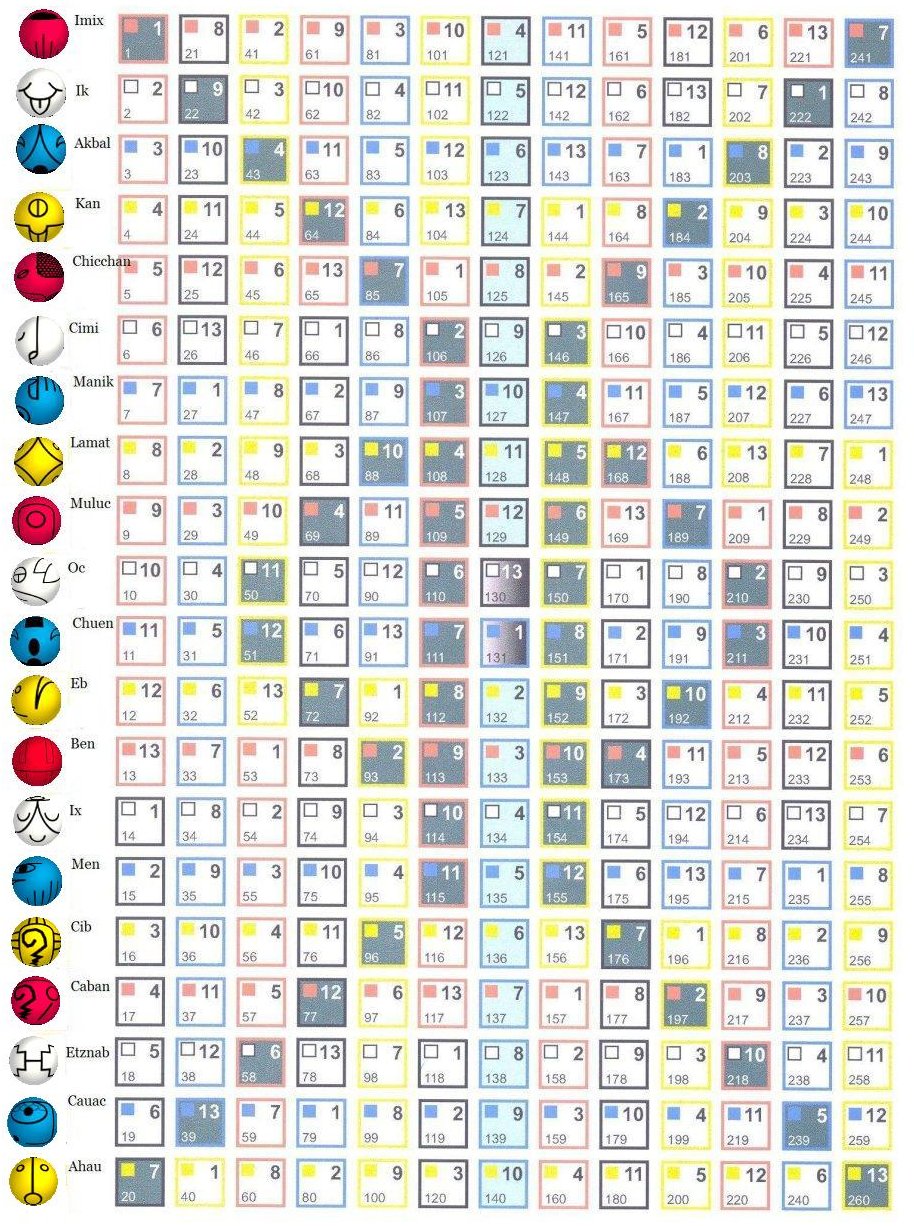
I believe that the Mayan Calendar is such a 'text', and have been focusing my work specifically on the base 'Tzolkin' calendar which essentially makes up one of the 16 'months' (260 days each) of the solar cycle (~11.2 years in Earth time).
My introduction to the calendar
When I first started learning about the calendar, I was looking at some of Jose Arguilles' work, who I am deeply thankful for. I believe the academy has tried to kill the role of imagination in knowledge, calling it misinformed, and that on some level his work was a victim of academics not understanding the nature of receiving information in the way he did.
Despite my respect for his work, I depart from his configuration of the 8 Tzolkin grid matrix he proposed in one important way, which you will see below.
Using mathematics as the language to interpret the calendar
Essentially, if you put 10 experts on algebraic topologies, and you as them to examine the Tzolkin calendar, that it could represent brane(ish) in the sense of these topologies and their relationships to the fabric of reality.
At some point I decided to focus purely on the grid (13X20) as a Mathematical entity. I came across Marko Rodin's work, and then of course, Randy's, and when I was watching this video I had an epiphany. It was specifically what Randy Powell said about 'mirroring'.
This is where I depart from Arguilles' work, in the arrangement of stacked grids. In Arguilles' concept he flips the grid over once on the vertical axis and once on the horizontal axis. I wanted to see what would happen if you just flipped the grid once on the horizontal axis, and then spliced the two together like a battery.
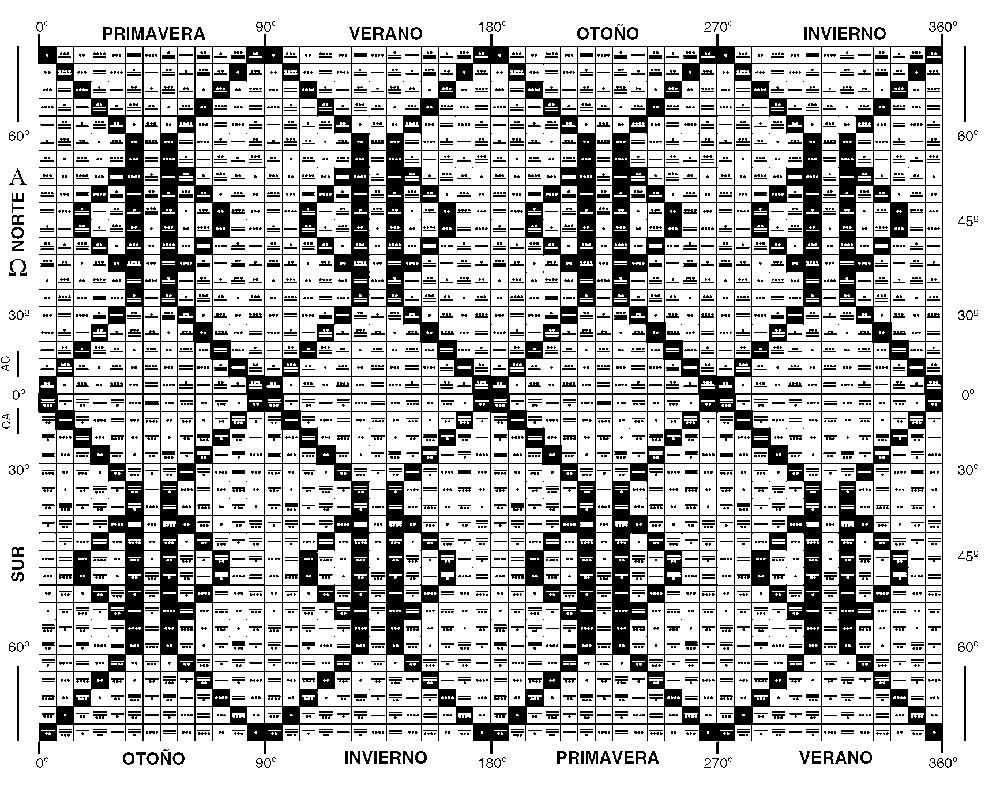
You can see above that the lower four Tzolkin and the upper 4 Tzolkin are not Mirrors. In Arguilles' Psi Bank, the top and bottom are flipped BOTH horizontally and vertically. In my work, although I tested Arguilles' set as well, I chose to only flip the grid horizontally.
Building the code to interpret the matrix grids
I have created a program to analyze all sorts of assortments of what happens when a matrix/grid get spliced together with their various mirrors in various ways (drool). It is still in it's infancy, but I wanted to present it here so that you can follow along what I am saying in this blog and play with it if you wish. I am also attaching some drawings, but want to explain what I did here.
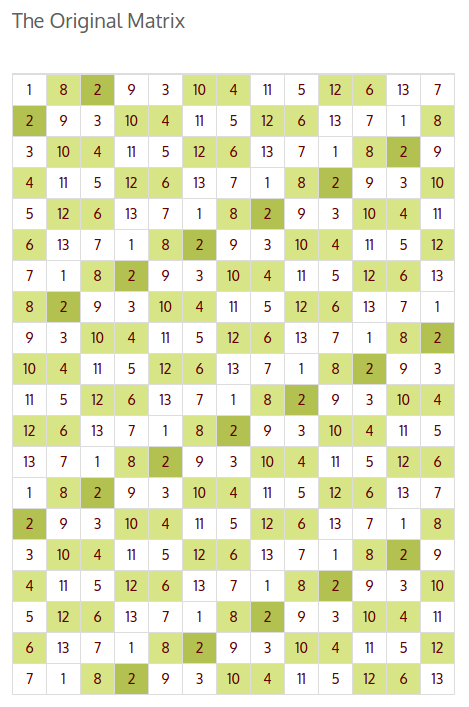
The Tzolkin calendar is basically a 13x20 grid in which one starts at the upper left hand corner and counts from 1 to 13 moving downward in the columns and then to the right, over and over again 20 times so that in total there are 13 columns with 20 rows. I have been looking at the mathematical relationships in that grid as a stand-alone single unit, as well as in a larger matrix of quarter (4 Tzolkin) and half (8 Tzolkin) solar cycles.
There are three things I noticed in Randy's presentation that resonated with what I was doing.
- The first is that much of the information Randy was working with is contained in a similarly derived matrix of 15x3in mod9 (drawings also attached below) which I had also been playing around with.
- The second, is that if you 'mirror' any of the matrices onto themselves (photos below) by inter-splicing them in a syncopated manner, the order of the matrix is enriched, and the relationships of the numbers in that 'mirrored' matrix seem to contain recipes for the toroidal system it's matrix describes.
- The the third is the connecting principle between my work and Randy's.
- The conversion between my spliced matrix and Randy's donuts is essentially a 'pivot table' type of situation. Look at the base-9 matrixes that you create, and imagine that instead of looking at those as a grid of squares, you turn it 45 degrees and look at it as a grid of diamonds. The diamond grid essentially can be seen as two grids spliced together. The corresponding grids are connected through their points instead of their lines. So the initial grid that composes the mayan calendar, for example, when spliced together with it's mirror create a matrix very similar to the ones Randy is using to define Toroidal energy patterns.
- Secondly, the AHBA (mod9) original Vortex grid has a third number that is introduced that defines the height of the grid so that number is no longer associated with the second number of the matrix (in this case 9 because he uses mod9 numbering).
- And thirdly, in the grids Randy is using the splice is offset as seen in the video I created to illustrate my point below:
The basic idea that was inspired by Randy's video was the interlocking of the grid and it's mirror together in a larger alternating grid.
I have indicated the two grids spliced together by giving them each a different color which you can see in the first series of grids.
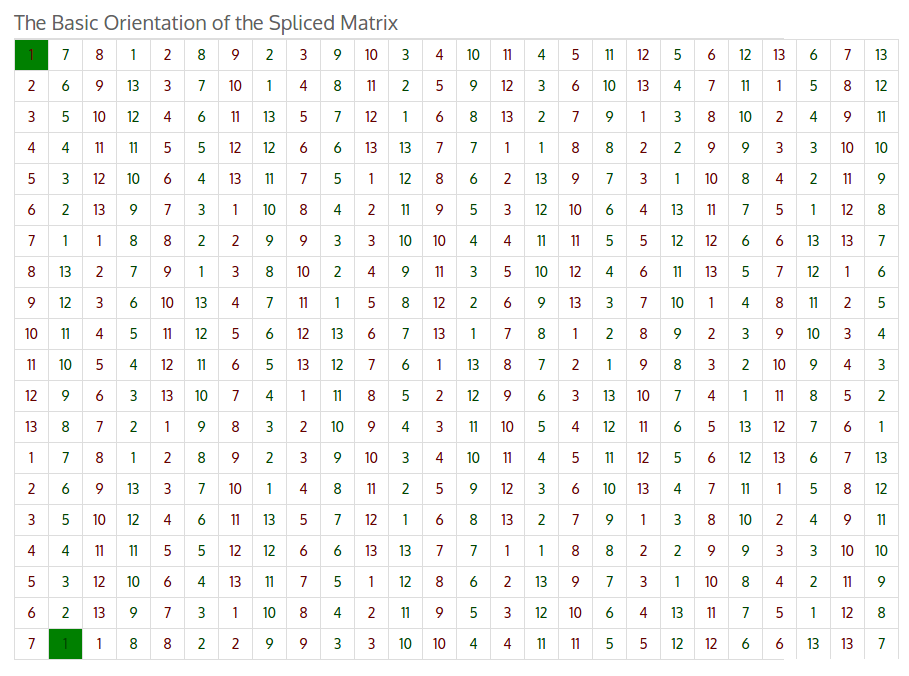
The matrix building and evaluation tool above takes this spliced grid and feeds it strong drugs.
More specifically when I looked at different patterns of numbers in the grid I noticed that the patterns created by odd and even numbers seemed to correspond with rows that have repeating adjacent numbers.
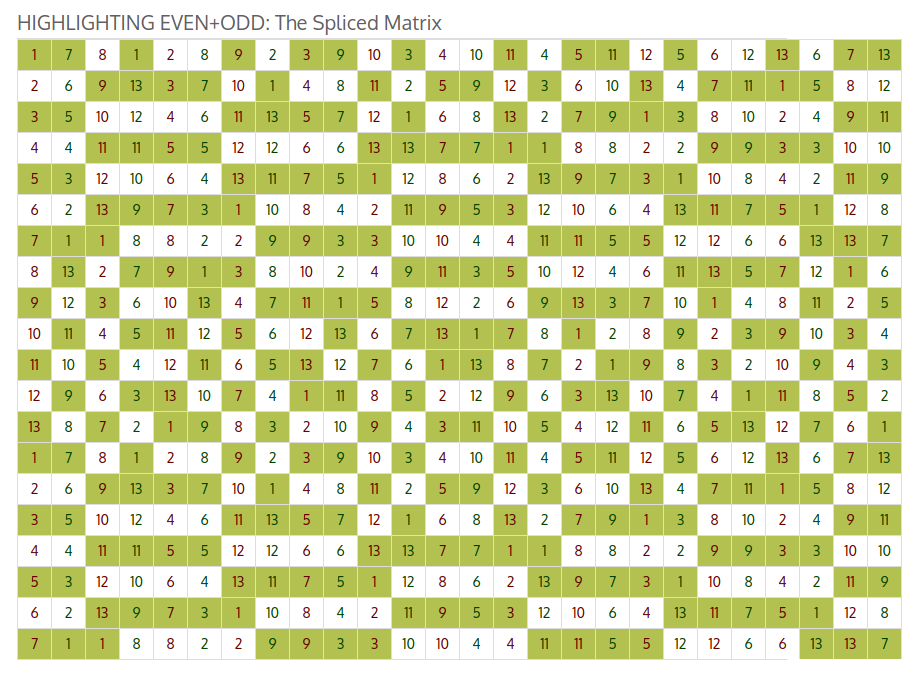
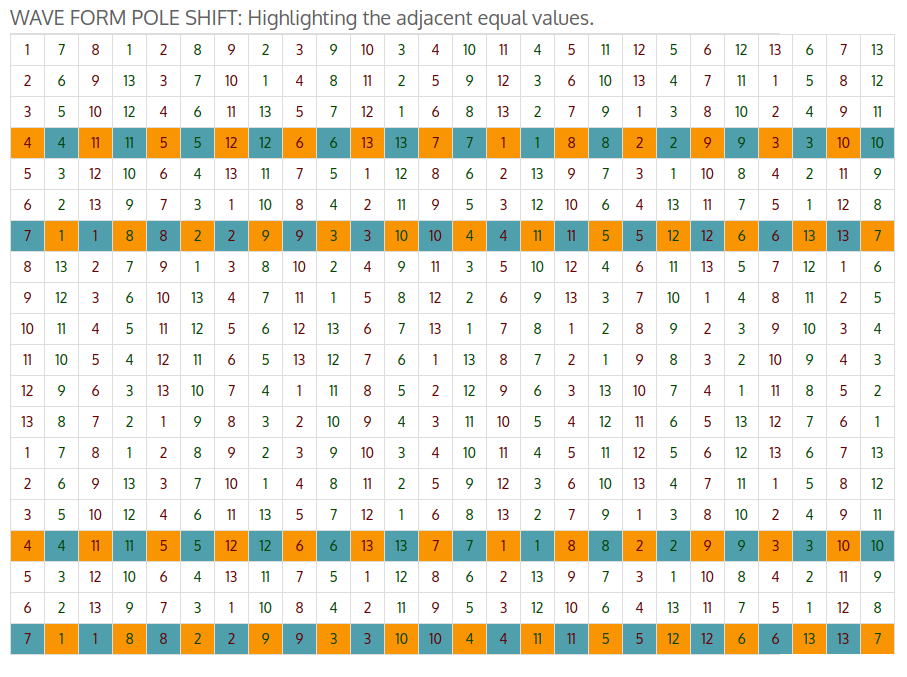
I then ran some calculations and realized that there is a concept of 'scale' in the sense of music. That the top row of the original matrix has a series of repeating numbers in a certain order that is repeated in every row of the original matrix. This number series seems to operate in a similar way that a musical scale would, in that it defines the underlying order of a piece of music.
In the spliced matrix, there are sine-like waves that appear in specific sections between the rows of adjacent equal numbers. These sine waves can move forward or backwards relative to the order of the original scale, they can have varying wavelengths, and they seem to alternate direction at in the rows that are filled with repeating adjacent numbers. Not only that, those crests of waves seems to also function in switching the polarity of the wave. In the spliced matrix, polarity refers to whether the waves are using the original grid columns or the columns from the grid that I flipped horizontally and spliced into the original matrix.
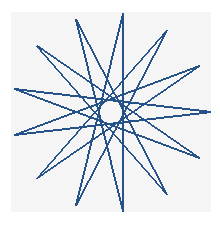
In the 13x20 system, the scale is always the same: 1, 7, 13, 6, 12 ,5, 11, 4, 10, 3, 9, 2, 6, 1 (all 6 digits apart in a 13-base counting system and which connected in a circle seem to create a pattern similar to a coil winding) and which can be seen below regularly switching 'polarity' as they move from one crest of the wave to it's opposite. As mentioned above, note in the 13x20 grid based on the Mayan calendar is that each instance in which the polarity switches happens at either the low or high extreme of the wave.
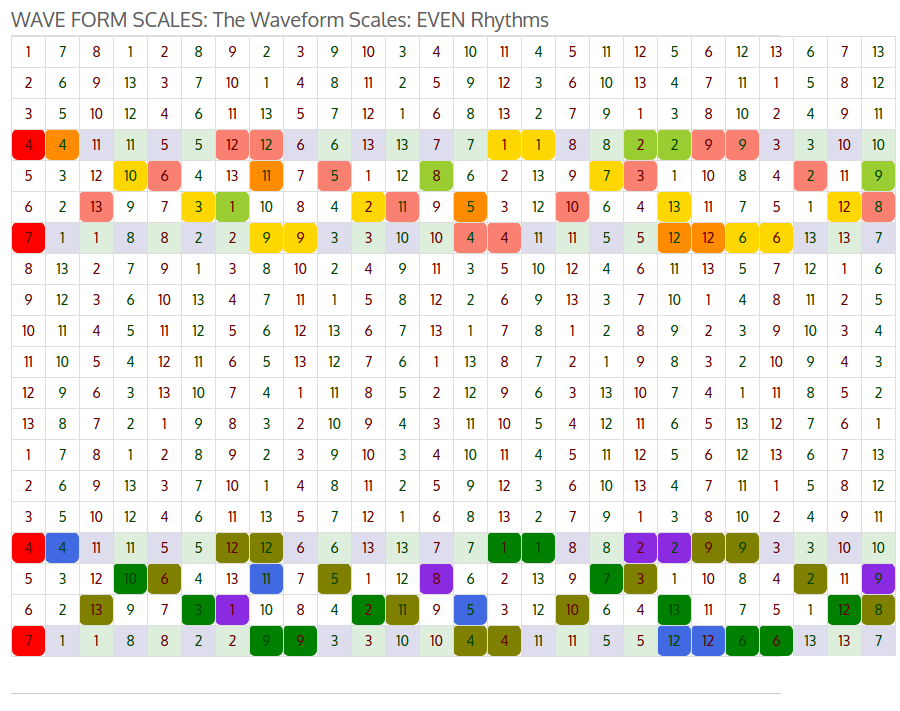
((( The 13/20 grid with a scale pattern of 1, 8, 2, 9, 3, 10, 4, 11, 5, 12, 6, 13, 7 )))
I found these patterns to be extraordinary (as well as others that I would be happy to detail in future discussions). An order that cannot be accidental.
In the drawings on the 13:20 grid colored in, the blue ratio like numbers (some of which are incorrectly marked on the drawing I sent but correct in the tool I have linked you to above) represent fractions denoted by how many integers are between each number in the row. If you notice in the attachment here the ratios creates by these numbers all exist along a diagonal line of the Lambdoma Matrix of Harmonic Internals.
The tool I created goes beyond this mayan Tzolkin set (13/20) and can evaluate an infinite set of pairing of numbers (within the bounds of the bandwidth of my server) and also generates calculations of the harmonics generated in each row. Generally, the rows of repeating numbers have harmonics of 'zero' or 'infinity' where the sine waves change polarity and switch direction at theirs crests. But I do not want to spoil it for you, go see for yourself!
Moire Patterns: macro patterns that reveal micro patterns.
Ever drive under a pedestrian bridge? I was living in Portland Oregon when I was younger, which has a lot of them. The city of Portland is concerned enough about the visual beauty of it's structures, that instead of using the normal gate grating to prevent suiciders from jumping off them, they often use instead metal walls with repeating patterns (like circles or plus signs) cut out of them. When you pass under one of these bridges, although you may not be able to see the actual shape of the hole cut through the wall from your car, the pattern formed between the two grates will magnify the shape of the original holes being used in those grates.
So Moire Patterns seem to magnify an underlying reality. The trick is that when you move under the bridge, the patterns between the two grates continue to form and reform themselves as you go under.
I started seeing these matrices as a sort of Moire Pattern, but wanted to test my assumptions. In this case, I specifically wanted to know what would happen if I move the two spliced grids up and down with respect to each other. Would the wave forms remain in tact? If they do, my presumption is that they are magnifying and underlying reality contained in the original grids.
So I made an offset component that you can see on the jellomatrix tool I built. It turns out, the wave forms stay in tact.
This, in my mind, indicates that these spliced grids do reveal a phenomenological coherence that reveal something about the relationship between these two numbers used to form the grids, and the methods used to create the spliced grid itself.
Next steps are to understand better what this coherence reveals. Here is a more personal account of my Odessey with this math.
Generated Lambdoma sound frequency ratios
If you scroll down on the page beyond these wave charts and definitions, you will see a series of charts with notes and frequencies on them. These frequencies are generated by repeating ratios between adjacent numbers. Because of the way the grids are built, the vertical up/down relationships simply count up and down adding or subtracting by one (not very interesting).
However, if you count in any other direction using the native counting system (based in the smaller number that is counted up to in creating the matrices) the differences between the adjacent numbers creates a repeating pattern of numbers, which also define a ratio that in turn represents a frequency that can be calculated into Hz. The notes and frequencies that you see in this part of the work use Pythagorean Lambdoma frequency charts to derive the relationship to the musical scale.
Because the ratios need to have a base number by which they are calculated, this base is most frequently given the value of 256hz or a mathematically nice to work with version of middle C. But any base frequency (representing the value of 1 can be selected. The tool I built enables the user to choose any base frequency they would like to use in these calculations of frequencies.
This is significant because it enables, for the perhaps the first time, for the notes collected to be formed into musical progressions that can be overlayed over one another. Because those generated relationships can be set up at any frequency as the base, it enables a wide range of experiments with sound in space, and a tool to generate those sound files. At the moment I am particularly interested in the canceling and combinatory effect of these sound progressions and relationships in physical space.
Examples of the Mayan calendar frequencies can be heard here for the combines waves with a 256 base frequency (6 layers of sound) and here for just the two primary horizontal sound progressions (2 layers of sound).
Solving for the 3D: extrapolating the matrix into 3 dimensions creating a fabric that is infinitely scalable in 6 directions.
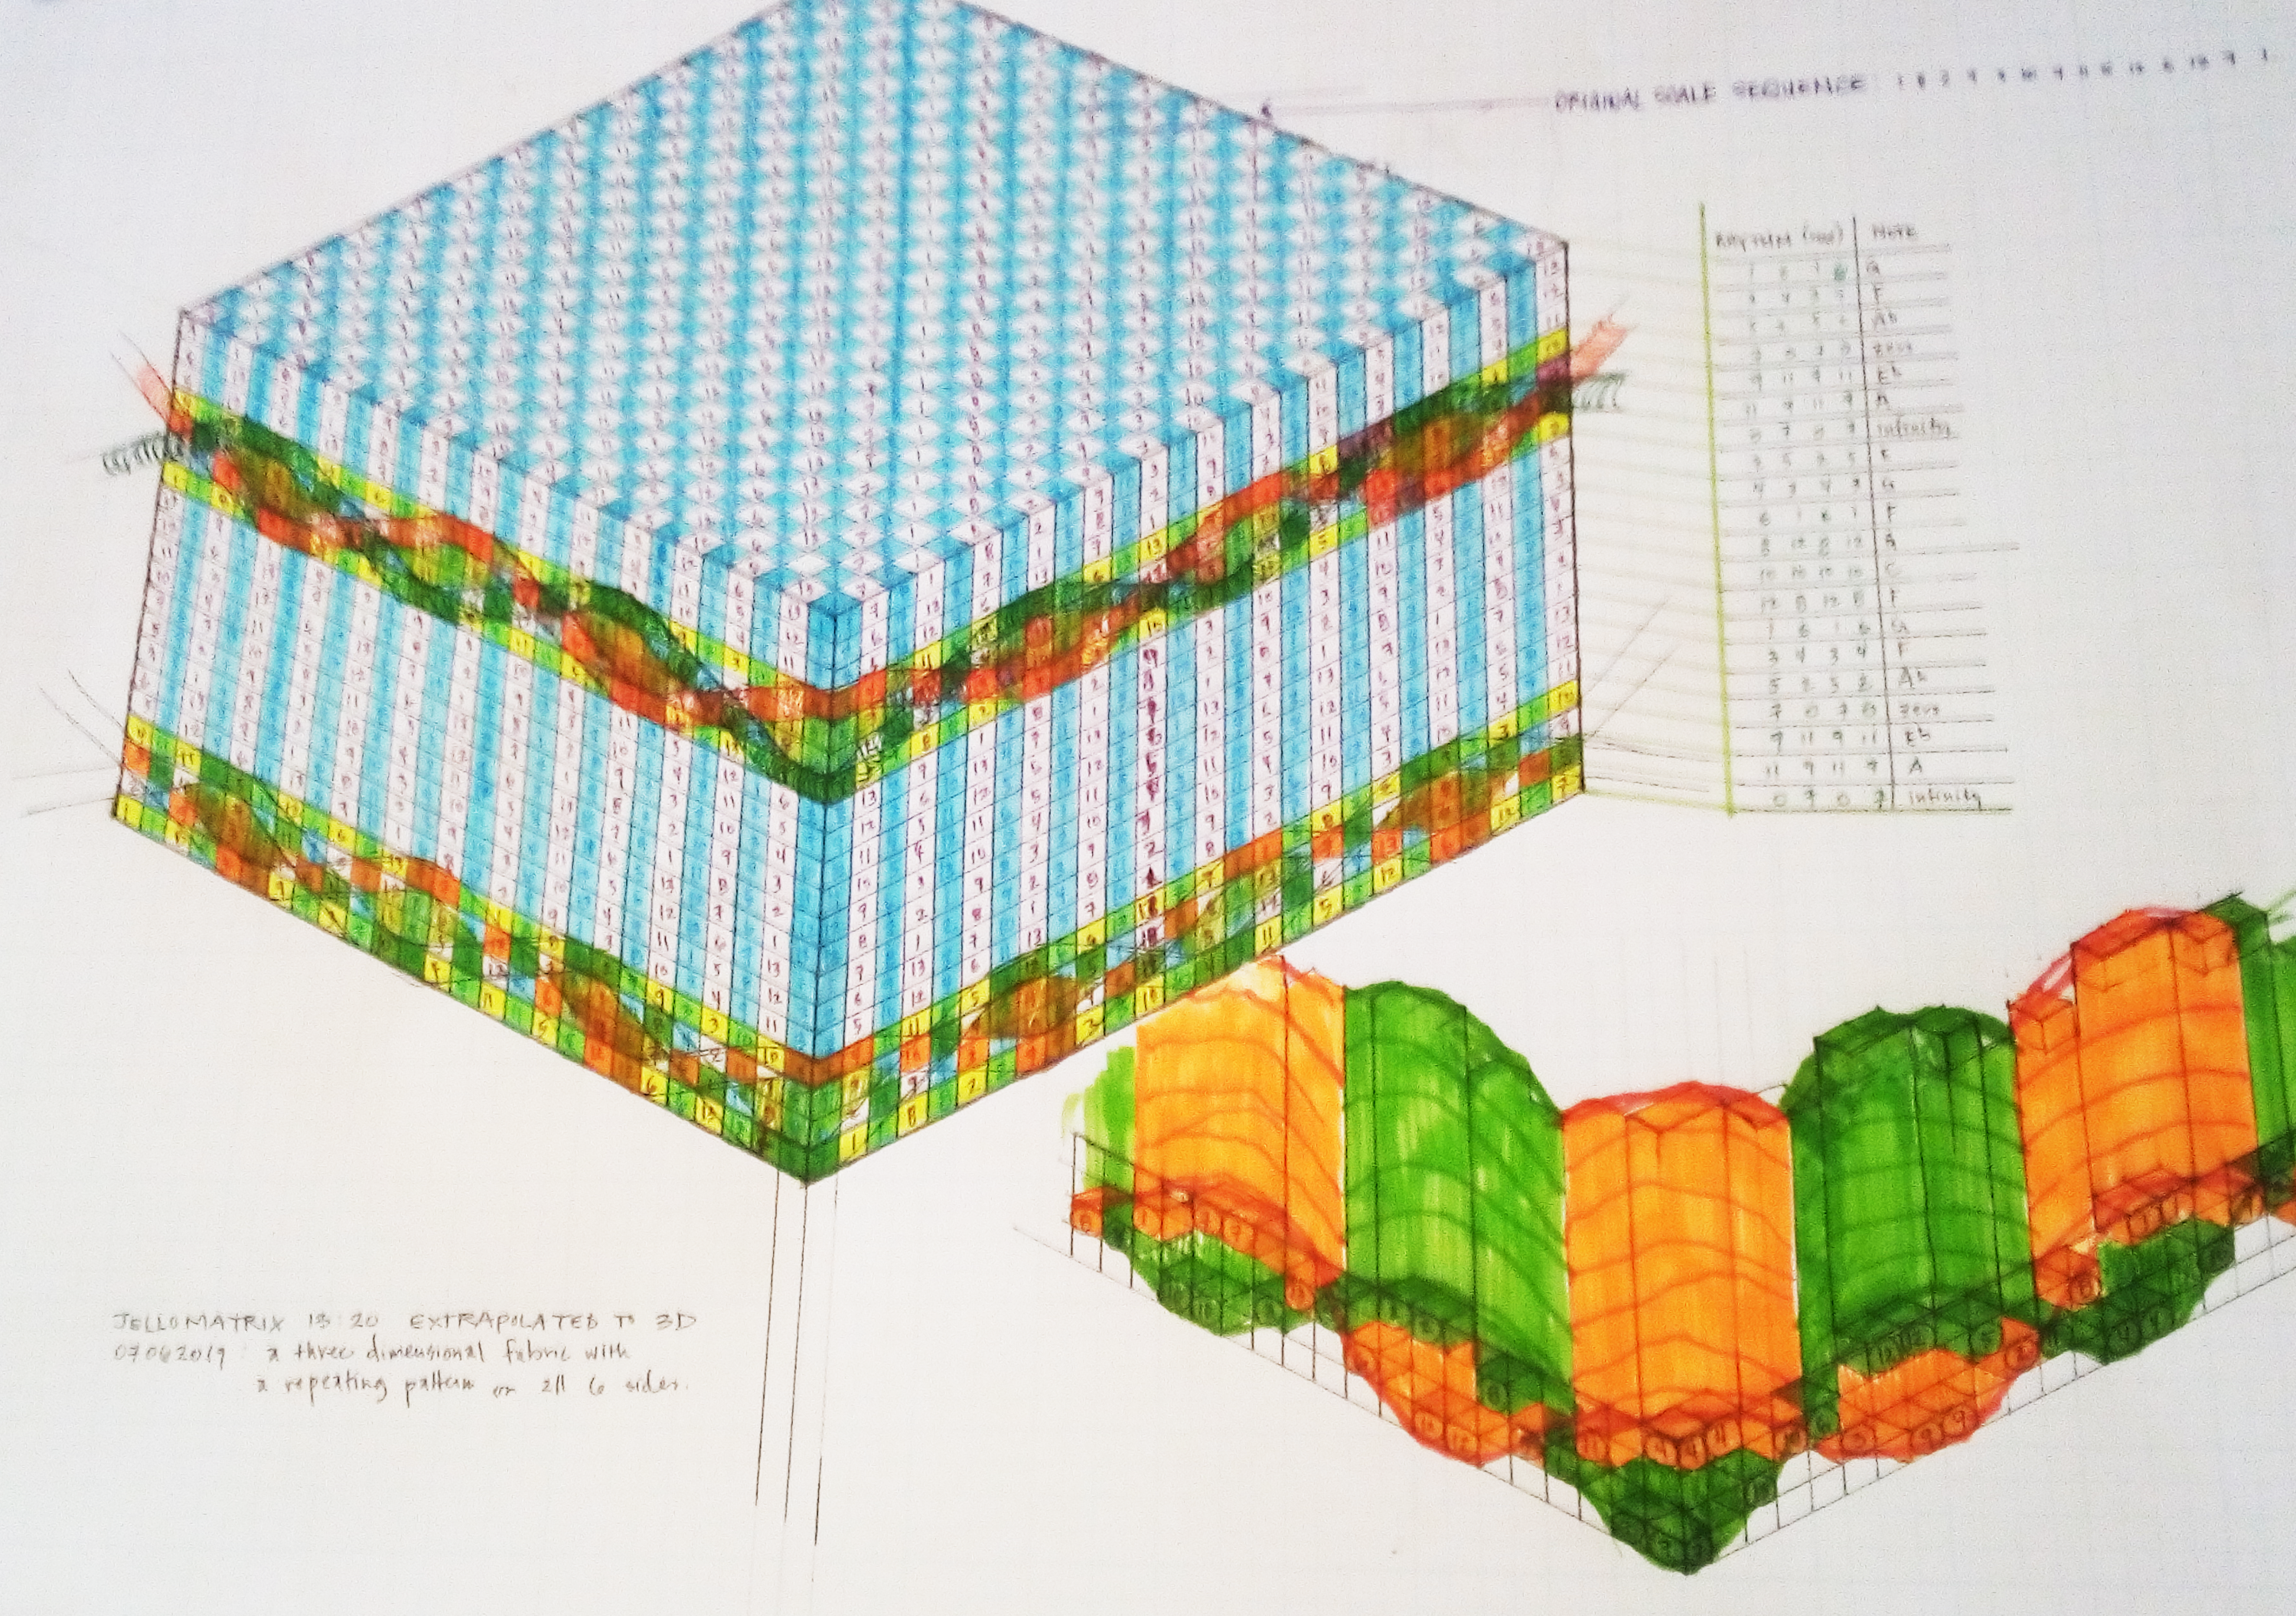

Wave Topologies encountered in the spliced Mayan Calendar by Ana Willem is licensed under a Creative Commons Attribution-NonCommercial-ShareAlike 4.0 International License.
Based on a work at http://jellobrain.com.
